Signals
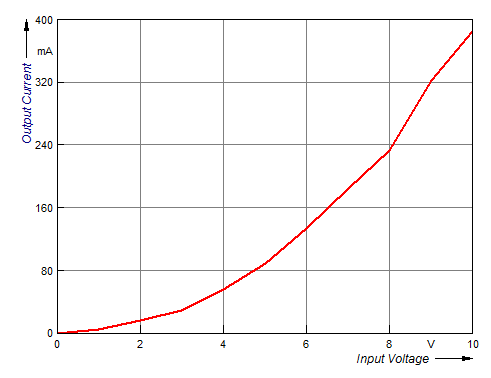
If you display the output current as a curve in a diagram in your spreadsheet, then the indices of the measurement values are first displayed on the X axis of the diagram. However, it makes more sense to display the measured characteristic curve, which means that you would have to write the input voltages belonging to the output currents measured onto the X axis. The two data series Input Voltage and Input Current thus together form a signal.

Signals very often occur in measurement applications, for instance, whenever you measure a time series. The times at which the measurement values were sampled form the X component, and the measurement values themselves form the Y component of the signal. Since signals occur so frequently, FlexPro offers you signals in their own data structure. A data set containing a signal consists of two data series of equal length, which are called X component and Y component.
If you display a data series in a diagram as a curve, then the X values are numbered consecutively, as is also the case in the spreadsheet. However, if you display a signal as a curve, the X values belonging to the signal's Y values are automatically displayed on the X axis. Analyzing signals is also easier than analyzing separate measurement series. An integration is then written as Integral('Characteristic Curve') instead of Integral('Output Current', 'Input Voltage'). You can access one of the signal components any time: Signal.x provides the X values and Signal.y provides the Y values. You can specify individual comments and the individual physical unit for each component in the data set. FlexPro recognizes more data structures than just the "Signal" data structure presented here. You can find out more under Data Structures.
FlexPro usually creates signals as soon as data are imported. If, for instance, you import two columns from an Excel workbook, FlexPro asks whether you want to import the two columns as a signal or as two separate data series.
Instead of creating signals, you can also assign data series to each other. Simply enter the data set with the X values as an assigned data set into the data set with the Y values. FlexPro can then automatically adopt the X data set when a diagram is created, for instance.
See Also
Importing a Data Series from an Excel Workbook
Next Topic
You might be interested in these articles
You are currently viewing a placeholder content from Facebook. To access the actual content, click the button below. Please note that doing so will share data with third-party providers.
More InformationYou need to load content from reCAPTCHA to submit the form. Please note that doing so will share data with third-party providers.
More InformationYou are currently viewing a placeholder content from Instagram. To access the actual content, click the button below. Please note that doing so will share data with third-party providers.
More InformationYou are currently viewing a placeholder content from X. To access the actual content, click the button below. Please note that doing so will share data with third-party providers.
More Information