Data Management
When working with a spreadsheet, you usually arrange all of the data that you want to analyze in a table. Scalar values, such as the serial number or the date of a measurement, occupy one cell in the table. The results of a series of measurements are usually arranged in one or more columns.
As long as the data volumes are small, this is very practical, since you have direct access to all of the data. However, this procedure is limited when you are working with large volumes of data or when the amount of data varies, as in a measurement series, for example.
In developing FlexPro, however, situations like these were taken into account. Data in FlexPro is therefore divided into multiple data sets that are stored together in a FlexPro project database. In this case, each data set only accepts data of the same type. If you look at the example table more closely, it is clear that it contains data with different data structures and data types. For example, the measurement number is a scalar value, the list with the samples is a data series with strings, and the input voltage and the output current are both data series, each with eleven values. As you can see, the data structure specifies how associated data is organized, and the data type specifies whether the data consists of floating point values, strings or other values.
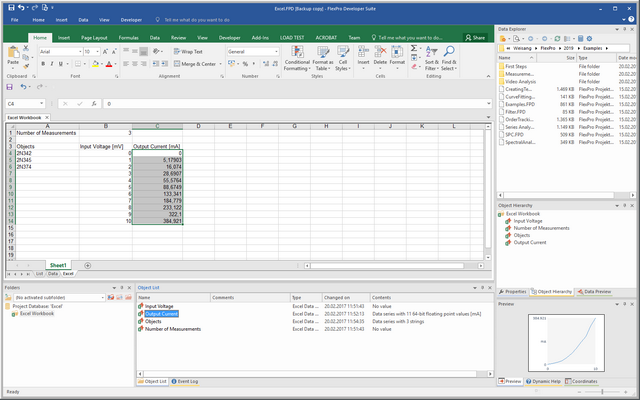
For each element in the example, FlexPro provides a matching data structure used for the corresponding data set. For example, the serial number of the measurement is saved as a data set Measurement Number with a scalar value. The list contains the test objects as a objects data set with a data series containing several strings and the Input Voltage and the Output Current as data series. In the illustration above you see an Excel workbook opened in FlexPro and the assigned data sets. In this example, the data sets are Excel data links, which means that they do not contain the data directly, but refer to the corresponding areas in the Excel workbook. You can convert these types of links into FlexPro data sets at any time. You then can edit data set values using FlexPro.
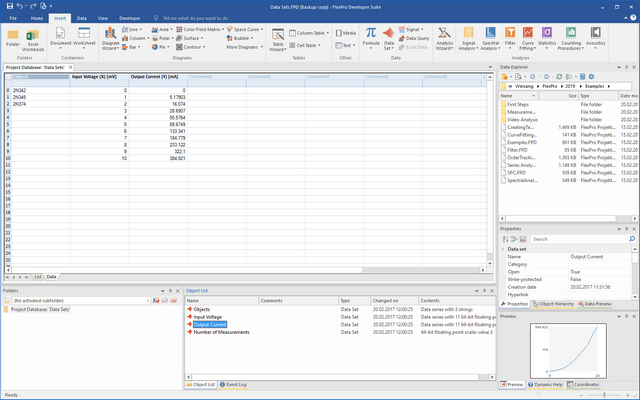
As the above picture illustrates, FlexPro can display data series similarly to Excel in a data grid, and you can easily edit them.
To work seamlessly with FlexPro, it is very important that you recognize which data structures are present. Often one is not aware of this when working with a spreadsheet, since the data structures implicitly result from the way the data is arranged in the table cells. A common mistake, for instance, is to place adjacent columns in a single data set, even though the columns contain different values. The following table will help you determine the correct data structure of the various elements in your spreadsheet.
FlexPro Data Structure |
Description |
Appearance in Spreadsheet |
Scalar value |
A scalar value, such as the date of a measurement, a single measurement value or another parameter |
A cell containing a value, such as the measurement number in the above example. |
Data series |
A column with several associated values. All values have to have the same physical unit. |
A column with several cells, such as the input voltages and output currents in the above example |
Data matrix |
A matrix of associated values. All values have to have the same physical unit. |
Several columns adjacent to each other. These matrices are used for surface graphics, for instance. |
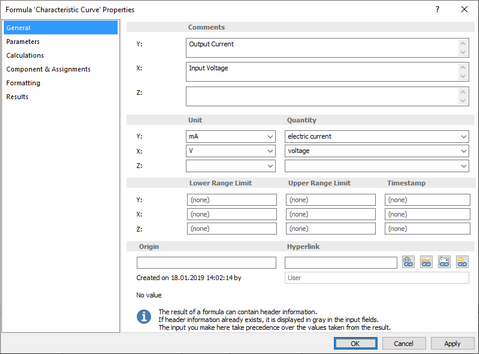
The data itself often also contains additional information, such as the physical unit or comments. This is saved as header information in the data sets. When the data is later displayed, FlexPro can access it and automatically label the diagram axes, for example.
See Also
Creating Excel Data Link Objects
Next Topic
You might be interested in these articles
You are currently viewing a placeholder content from Facebook. To access the actual content, click the button below. Please note that doing so will share data with third-party providers.
More InformationYou need to load content from reCAPTCHA to submit the form. Please note that doing so will share data with third-party providers.
More InformationYou are currently viewing a placeholder content from Instagram. To access the actual content, click the button below. Please note that doing so will share data with third-party providers.
More InformationYou are currently viewing a placeholder content from X. To access the actual content, click the button below. Please note that doing so will share data with third-party providers.
More Information


