Fourier Spectral Analysis Tutorial
This tutorial covers the Fourier spectral analysis capabilities of FlexPro for those instances where you want to characterize very low power components within wide sense stationary signals and where low variance spectral estimates are desired.
A Suitable Test Signal
For this tutorial, we will use a signal that contains four equal power reference sinusoids across the Nyquist range and three low power sinusoids placed between them. The low power components will be -40 dB, -50 dB, and -60 dB below the reference sinusoids. White noise will then be added so that a noise floor exists at approximately -75 dB. The object of this test is the accurate frequency and power estimation of these three low power components. A secondary focus will be the recovery of phase information for these components.
The four reference sinusoids and three lower power sinusoids are defined as follows:
1.0*sin(2π*x*1005+p/2)+ (0dB)
1.0*sin(2π*x*2005+p/2)+ (0dB)
1.0*sin(2π*x*3005+p/2)+ (0dB)
1.0*sin(2π*x*4005+p/2)+ (0dB)
0.01*sin(2π*x*1505+p/2)+ (-40dB)
0.003162*sin(2π*x*2505+3p/2)+ (-50dB)
0.001*sin(2π*x*3505+p) (-60dB)
The x (time) values vary from 0 to 0.1 with a 0.0001 sample increment. The Nyquist frequency is thus 5000 (half the 10000 sampling frequency). The four reference sinusoids span the Nyquist range. The first low power sinusoid (-40 dB) has 1% of the amplitude and 0.01% of the power of one of the reference sinusoids. The next low power sinusoid (-50 dB) has 0.001% of the power of the references. The last of the test sinusoids (-60 dB) has only 0.1% of the amplitude and 0.0001% of the power of the reference sinusoids. Gaussian Noise at 0.15% was added to create a white noise floor at about -75 dB. It should thus be possible to resolve even the -60 dB component given a well designed spectral analysis.
Select the command File > Open Project Database and open the project database C:\Users\Public\Documents\Weisang\FlexPro\2021\Examples\Tutorials\Spectral Analysis.fpd or C:>Users>Public>Public Documents>Weisang>FlexPro>2021>Examples>Tutorials>Spectral Analysis.fpd. Open the Tutorials folder and its Fourier Spectral Analysis subfolder and then double-click to open the 2D diagram called Data .
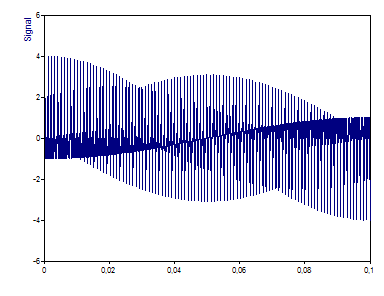
This is a graph of the signal. There are 1001 floating point values.
The Non-Windowed Fourier Spectrum
For high dynamic range Fourier spectral analysis, data tapering windows are almost always used. In order to see why, we will first explore a basic or non-windowed FFT.
Close the diagram and highlight the data set Signal.
Click on Insert[Analyses] > Analysis Wizard.
Select the Fourier Analyses under Spectral Analyses. Next, select Fourier Spectrum. Click on Next.
Step 2 of the Analysis Wizard contains an interactive dialog where multiple procedures can be optimized and compared in order to achieve the best possible analysis. We will begin by exploring the non-windowed Fourier spectrum.
Note that for Spectral Procedure, the option Fourier Spectrum is checked. Although the Spectral Procedure was selected in Step 1 of the Analysis Wizard, this can be modified in Step 2.
Select for the Spectrum Type the value dB normalized.
This normalizes the largest spectral peak to 0 dB. All other peaks will have a negative value. A peak at -3 dB would have half the power of the 0 dB peak, and a peak at -6 dB would have half the amplitude.
For the Window Type select Rectangular -13dB W=1.
In FlexPro's Spectral Analysis module, all fixed width (non-adjustable) data tapers are listed by their names, the side lobe attenuation in dB, and the one-sided Fourier domain peak width. A rectangular window is the same as no windowing, as all data elements are multiplied by unity.
Make sure that the FFT length is set to data length or 1001.
The Zero Pad informational field shows that no zero padding has taken place.
Select Maximum peak count under Options and enter the value 7.
The Analysis Wizard automatically generates spectral peak information. With this option set to 7, the seven peaks of highest power will be output. Note that it is also possible to set a dB threshold below the largest peak. For this data set, we could have as easily set a -65 dB threshold.
Now set the White Noise Critical Limit % to None.
Later in this tutorial, we will apply critical limit testing to this signal.
If no labels are visible above the peaks, click on Toggle Labels until the amplitude labels appear.
You can switch between several states. You can toggle through to label states, displaying the y-component of the spectrum (here it is dB normalized), the x-component (always frequencies), or no peak information.
The Fourier plot in the Analysis Wizard should be as follows:
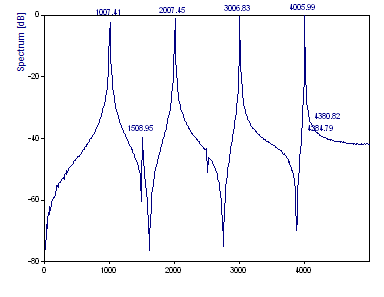
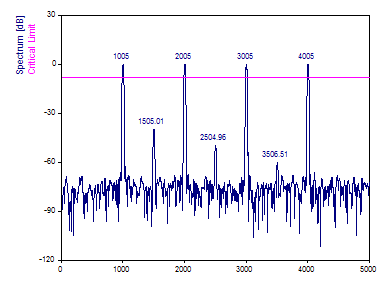
The FFT computation uses the fastest available FFT algorithm that exactly transforms the data. In this instance, the Prime Factor FFT algorithm is used since it is the fastest FlexPro FFT procedure that exactly processes the data size of 1001. The Fourier spectrum that is produced readily detects the four reference peaks. The -40 dB peak is observed. There is only a hint of the -50 dB peak and no evidence of the -60 dB peak. Even though FlexPro uses a cubic spline bin interpolation to refine the FFT peak frequencies, the reference frequencies of 1005, 2005, 3005, and 4005 are not exactly recovered.
Note that the four references consist of peaks that have substantially different shapes. The spectral peaks become sharper as the frequencies increase. This is not a product of frequency, but rather of spectral leakage to adjacent bins. The more closely a harmonic is centered within a spectral frequency bin, the sharper will be the FFT frequency response.
Select the upper plot and click on the Activate Cursors button. Place the cursor on the first peak.
Observe that the first peak's actual frequency of 1005 must be accommodated by FFT bins with frequencies of 999 and 1009. The fourth peak's actual frequency of 4005 can be mostly accommodated by a 4006 frequency FFT bin. Only when a frequency falls in the exact center of a bin can a harmonic be entirely represented by a single FFT channel.
Click again on Activate Cursors to disable cursoring and then change the FFT length to 8192.
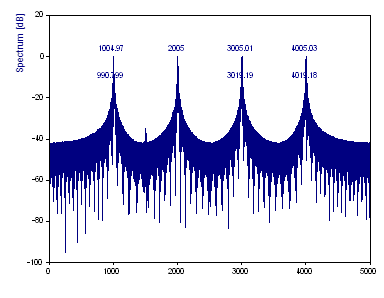
This increases the size of the FFT using zero padding. There are now approximately eight times as many frequencies within the spectrum. The bin-interpolated frequencies of the references are now accurately determined, but the three low power components are lost in the baseline. The spectral leakage increases since zero padding introduces a discontinuity in the data stream.
Enter 2000 in the FFT Length field. To trigger the update, leave the edit field by pressing the Tab key.
This produces an FFT spaced at exactly 5 Hz intervals. The frequencies of all seven of the sinusoids are now exactly in the center of an FFT bin:
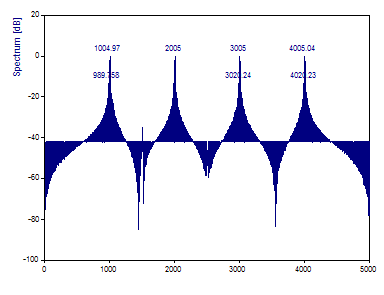
The spectral peaks are now impulse functions, but the spectral leakage introduced by zero padding is sufficient to mask the three lower power components. It is not possible to resolve the low power components without using a data tapering window.
Windowed Fourier Spectra
A data tapering window reduces the magnitude of the data values to zero at each end of the data stream. While this increases the influence of data in the center of the data stream and diminishes the influence of data near the bounds, this does eliminate the discontinuity at the bounds of the data. If the data were to be viewed in a wraparound format, a continuity would be observed where the two ends meet.
The influence of adding a data tapering window is not neutral in the Fourier domain. The data window will have a frequency response that widens any spectral peak, thus reducing its resolution. Low power harmonics are also introduced. The benefit is a dramatic reduction in spectral leakage, enabling any measure of zero padding to be used.
In FlexPro, a power normalization is made whenever a data window is used. The power of a windowed Fourier spectrum is identical to the power of its non-windowed counterpart. On the other hand, even with this conservation of power, the height of the spectral peaks will evidence some attenuation as a consequence of the windowing. When a data tapering window is used, it is still possible to judge relative power using a normalized dB scale, but it is no longer possible to directly read absolute amplitudes or powers using the spectral peak heights.
Change the Window Type to Cos4 Blackman-Harris -92dB W=4 and set the FFT length to 8192.
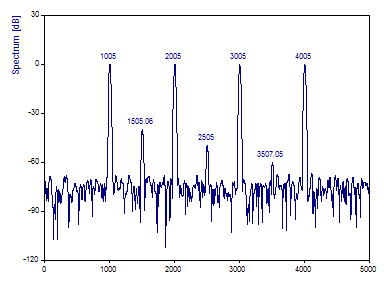
Click on Toggle Labels to display spectral magnitudes as labels.
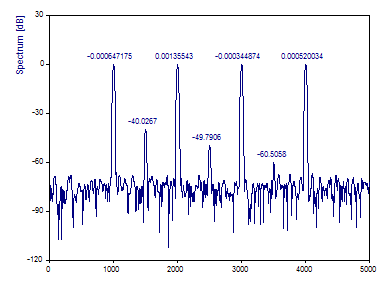
This Blackman-Harris window is a popular one for high dynamic range Fourier analysis. The four reference peaks are accurately mapped for both frequency and power. The three low power peaks are also well characterized for both frequency and power.
Note that an exact 0 dB peak is not present. The zero dB normalization occurs on the actual spectral values. The peak values reported are bin-interpolated, and as such, the highest power peak will typically be slightly above 0 dB.
Data Tapering Window
Selecting a suitable Data Tapering Window takes practice. In FlexPro, there are twenty fixed property windows, and nine whose properties vary as a consequence of an adjustable parameter.
The main lobe width reported in the selection list as parameter W is directly related to the frequency resolution. A window with a main lobe width of 3 will have only 1/3 the frequency resolution of an unwindowed Fourier spectrum. The Sidelobe value also reported in the selection list is the extent in dB the largest side lobe peak is below the primary peak. The higher the side lobe value, the better the likelihood of resolving a low power peak in close frequency proximity to a higher power component. Another factor in window selection is the Rolloff value. The greater the rolloff, the greater the chance for resolving low power components far from the primary spectral peak. The Sidelobe value is a measurement for the occurring spectral leakage and the rolloff value specifies how this is distributed on the spectrum.
The primary tradeoff is resolution against dynamic range, and this is determined by the main lobe width. The secondary tradeoff is resolution of adjacent peaks versus widely-spaced peaks. This is determined by the side lobe and rolloff characteristics.
The Chebyshev window produces the sharpest spectral peak for a given side lobe level. It is an excellent tapering window for resolving closely spaced components of different power levels. The Cosine Maximum Rolloff window produces the fastest cosine-based decay in the frequency domain making it possible to resolve very low power peaks located some distance from the primary spectral peaks. The Kaiser-Bessel window is a very good adjustable window that offers an effective compromise between the two extremes.
The Flattop window represents a unique feature. This window has a main lobe maximum width of 5, thus offering a relatively low spectral resolution; however, the main lobe maximum has almost the same value within the complete band from one frequency line to its adjacent neighbor on the left and right. The main lobe maximum therefore shows a wide, but flat peak. This window is especially suitable for measuring powers or amplitudes of narrowband signal components, i.e., individual peaks in a spectrum. Through the special type of main lobe maximum, the height of a peak is actually independent from its location between two frequency lines.
Significance Levels
FlexPro offers peak-based critical limits for ascertaining whether or not a signal's peak is statistically significant. The reference is white (normally-distributed) noise. A 95% critical limit is that level where in only 1 of 20 separate random noise signals would the largest peak present achieve this height strictly due to random chance. A 99.9% critical limit is similarly that level where in only 1 of 1000 separate random noise sets would the largest peak attain this height.
FlexPro's critical limits are based on extensive Monte Carlo trials using the actual algorithms and adjustments in the program. In this instance, separate critical limit models are used for each of FlexPro's data windows. For adjustable windows, 3D surface models are used. Since this approach incorporates the peak height attenuation that occurs when data windows are used, the critical limits are accurate for all n, all data windows, and all data window adjustable parameters.
Change the White Noise Critical Limit to 99.9%.
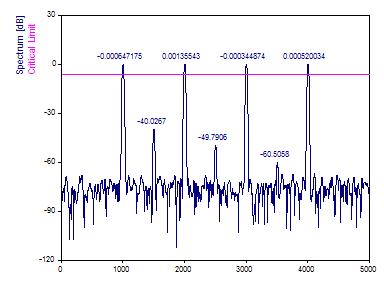
In this data set, the largest peak is shown to be significant in excess of a 99.9% confidence. This test compares only the highest power spectral feature to Gaussian noise. No inference can be made relative to any other peak.
References
For comparison purposes, we will save this plot as a reference.
To do this, click on Set Reference.
The reference replaces the data plot. Note that critical limits and peaks are not included in references.
Low Variance Spectral Analysis
We will now explore FlexPro's spectral methods for instances where low variance spectral power estimates are needed. Here it is assumed that accuracy in the power measurements is the primary consideration.
Reducing Variance in Spectral Measurements
The variance of an FFT does not decrease when the data length is increased. Instead, the variance is a constant whose square root (standard deviation) is approximately equal to the mean power present in the signal. To reduce the variance of FFT-based spectral estimates, ensemble averaging and orthogonal taper techniques are used.
Periodogram (Segmented-Overlapped Fourier Spectrum)
There are two Fourier procedures in FlexPro that can be used to produce reduced variance spectral estimates. The first of these is the "periodogram". For a stationary data series, each subset of the full data sequence should have the same spectral characteristics. It is thus possible to sum a series of FFTs in order to produce a lower variance estimate. The FFTs are made within a sliding window (a smaller segment size) that is moved across the data sequence with a specified measure of overlap. The smaller size FFT results in decreased resolution. The resolution is sacrificed in exchange for less variability in the final spectral estimates.
For the Spectral Procedure, select the option Periodogram. For the Spectrum Type continue to use the setting dB normalized. Select the Chebyshev window and set the one-sided Fourier width (Window adjustment ) to 4.0. If necessary, adjust the Segment Length to the default of data length/4. Set the FFT length to 4096 and Overlap % to 90. If no labels are visible above the peaks, click on Toggle Labels until the amplitude labels appear.
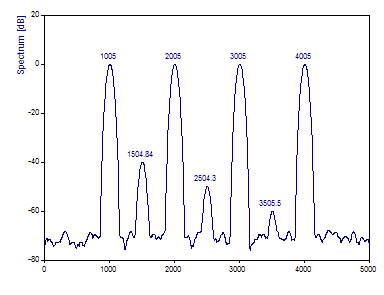
Click on Toggle Labels to display the dB spectral densities.
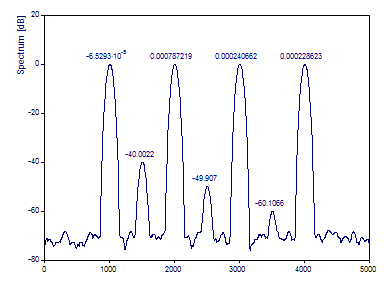
With the default n/4 (250) segment length and an overlap of 90%, there are 31 discrete segments being combined to produce a low variance spectrum. Because the segment length is only one-quarter the length of the full data stream, the resolution in the frequency domain is proportionately diminished. That is why the peaks are much wider in the Periodogram. However, there are 31 individual Fourier spectra being summed to produce the overall Periodogram. For this reason, the three low power peaks are more accurately characterized for power.
The Chebyshev window was used here because there is a constant white noise floor across all frequencies. There is no advantage in a window with significant rolloff characteristics. If red noise (noise that diminishes with increasing frequency) had been present, a window with very high rolloff, such as the Beta or Cosine Maximum Rolloff, would have been a better choice.
Optimizing the segment size and overlap is not generally a pleasant task. In general, a large number of segments will not substantially improve the variance. Typically, there is little variance reduction beyond 50-70% overlap, regardless of whether data windowing is used.
Amplitudes and Data Tapers
This is a good place to observe the impact on amplitudes when a data taper is used.
Change the Window Type to Rectangular -13dB W=1 (no windowing), Normalization to None, and change the Spectrum Type to Amplitude.
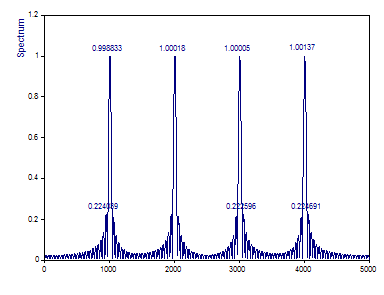
Note that the amplitudes of the four reference sinusoids, each 1.0, are very accurately recovered because of their high overlapping.
Change the Window Type to Cos2 Hamming -43dB W=2.
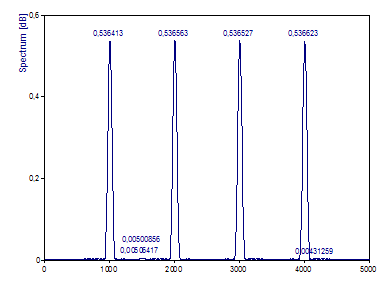
The Hamming window is the minimum side lobe cosine series window for a one-sided Fourier width of 2. Note that the amplitudes in the peak have been reduced by about 50%. If the spectrum consists of separate peaks, the reduction only depends on the selected window function and can be compensated very easily.
change the Normalization to Amplitude.
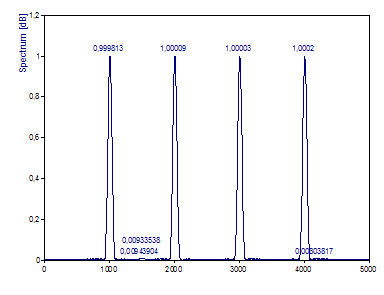
The amplitudes of the peaks are exact the same as the reference oscillations in the signal. The amplitude normalization uses the gain of the selected window function as a normalization factor, that is the sum of the squared values of the window function divided by their number. Please note this kind of normalization will not ensure that the total power in the spectrum is equal to the one of the time signal. In cases where this is requested, the type of normalization Power is available.
Optimizing the Periodogram
Change the Window Type to Cos3 Minimum Sidelobe -71dB W=3.
The -71 dB side lobe damping listed in this window's description suggests that there should now be a sufficient dynamic range to recover the three low power peaks.
Change the Spectrum Type to dB normalized.
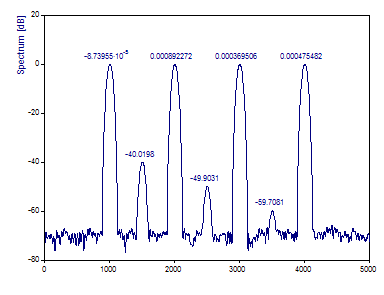
Note that the three low power narrowband components are indeed resolved using this data taper. The spectral peaks are also sharper with this width 3 window than in the width 4 Chebyshev taper we first evaluated. While it was not important in this instance, there may be cases where closely spaced spectral features require the use of a window whose side lobe dB is just below that of the noise floor of the data. Note that the adjustable windows are continuous, and that it is possible to set any fractional Fourier width desired.
Change the Window Type to Chebyshev and set the one-sided Fourier width, the Window adjustment to 2.9.
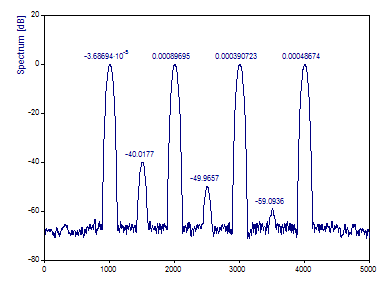
This represents a close to optimum data taper for minimizing the width of spectral peaks. The peaks are the minimum width for resolving the lowest power components above the noise floor. These are not, however, necessarily the optimum settings for the periodogram. If some of the improved variance is sacrificed, a much sharper spectrum is possible.
Select 500 from the Segment Length dropdown list and keep the Overlap % at 90 .
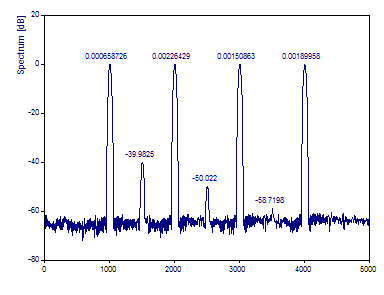
When these settings are used, 11 half-length Fourier spectra are used to generate the periodogram. Note that the spectral peaks are much sharper. The greater variance is likewise evident in the noisier floor of the spectrum and in the very weak recovery of the lowest power component.
Multitaper Spectral Analysis
The second Fourier option in FlexPro for generating reduced variance spectra is the multitaper procedure. In a multitaper procedure, a set of orthogonal tapers is applied to the data and the spectrum from each is averaged in some manner to produce a composite spectrum. Unlike the segmented-overlapped approach which uses only a portion of the data stream for each individual spectrum, a multitaper procedure uses the full data stream with each taper.
A multitaper procedure is somewhat similar to averaging the spectra from a variety of data tapering windows. In that case, there would be a certain redundancy since the different tapering windows are highly correlated (all have a very common peak shape). Unlike conventional data tapers, the orthogonal tapers used in producing a multitaper spectrum are uncorrelated. Only the first of the data tapering windows has the traditional shape.
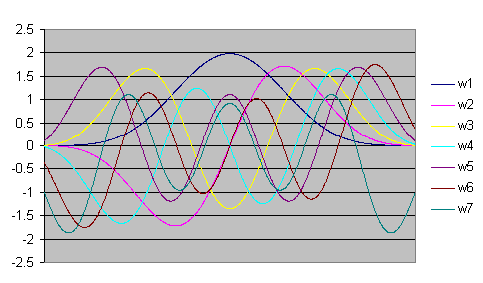
The spectra from the different tapers do not produce a common central peak for a harmonic component. Only the first taper produces a central peak at the harmonic frequency of the component. The other tapers produce spectral peaks that are shifted slightly up and down in frequency. Each of the spectra contribute to an overall spectral envelope for each component.
The advantages in multitaper analysis are that no Fourier resolution is sacrificed and there is no loss of information at the extremes of the data. Whereas the information near the bounds is indeed lost with the first taper, it is included and indeed emphasized in the subsequent tapers. The spectral envelope associated with each component makes relative power determinations a straight forward matter. The disadvantage is that the spectral envelope associated with each component does not readily offer sharp frequency resolution.
The multitaper procedure performs always a normalization of the power for the resulting spectrum. Thus, selecting None and Power from the Normalization list gives you the same result. The Amplitude type of normalization can be used in the same way as with the periodogram to compensate the attenuation of the amplitude of the peaks within the spectrum. The normalization factors were determined empirically as a function of the number of windows and the window width.
Select Multitaper spectrum as the Spectral Procedure and select the normalized dB spectrum type. Set the one-sided Fourier width (Window adjustment) to 3.0. For the Number of DPSS windows enter maximum or 5. Set the FFT length to 4096. Click on Toggle Labels until the frequencies are displayed above the peaks.
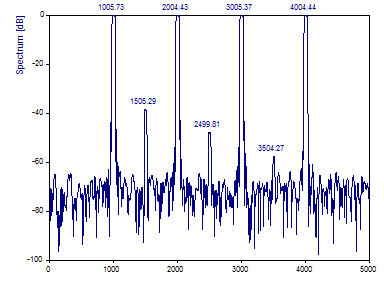
Note the table-top shaped spectral peaks characteristic of a multitaper spectra. This shape makes it easy to visually discern the relative spectral power, but it is hard to locate the central frequency of the envelope that defines each peak. FlexPro uses the peak locations in the F-ratio spectrum to assign peak frequencies. The F values are a measure of significance and are not directly related to the variance.
Click on Toggle Labels to display the dB spectral densities.
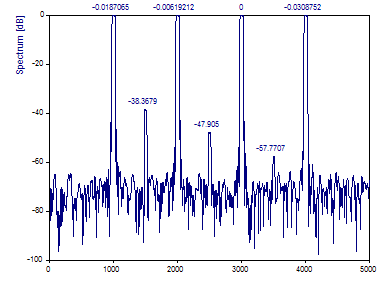
Note that, unlike the periodogram, the averaging of the spectra from the orthogonal tapers does not result in a smoother noise floor.
Because the multitaper envelope does not have clean well-defined peaks, the maximum in the spectra may not be determined to a high accuracy. That is one possible reason why all three of the low power peaks are off by +2 dB in the normalized spectrum.
A cautionary note in multitaper spectral analysis involves the use of the maximum number of supported tapers. For a Fourier one-sided width of 3.0, FlexPro supports up to 5 tapers. For a width of 4.0, up to 7 DPSS tapers can be used. The dynamic range of the individual DPSS tapers diminish as the sequence progresses. The first DPSS taper, w1 in the DPSS plot, is an excellent data window and it offers the best dynamic range of the sequence (this is the Slepian adjustable window in the Fourier and Periodogram procedures). Each subsequent taper in the DPSS sequence offers a diminished dynamic range. It is often best, when a wide dynamic range is desired, to exclude the last taper or two in the sequence. For example, for a Fourier width 3 setting, a total of 3 or 4 tapers may be the better choice. For a Fourier width 4 spectrum, 5 tapers may give the best results.
Change the Number of DPSS windows to 3.
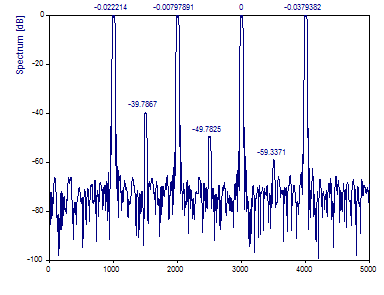
Note that the spectral peaks are appreciably more accurate.
Multitaper Amplitude Attenuation
Change the Number of DPSS windows to 5 or maximum. Set the Normalization to Power and change the Spectrum Type to Amplitude.
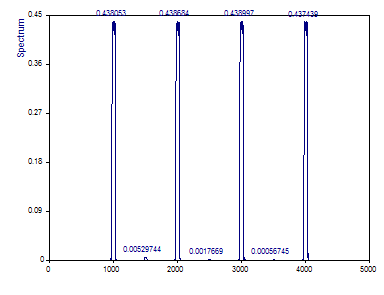
For the periodogram with a Fourier width 3 data taper, the amplitude attenuation was about 24% (76% of the actual amplitude was present in the peak channel). For the multitaper with a Fourier width 3, the attenuation is a much larger 56% (only 44% of the actual amplitude is evident in the plateau of the multitaper spectral envelope).
Change the Number of DPSS windows to 3.
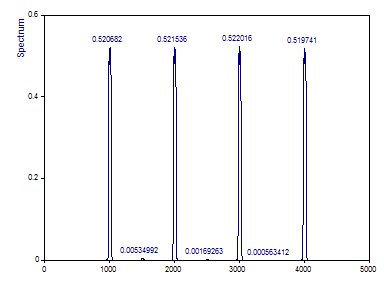
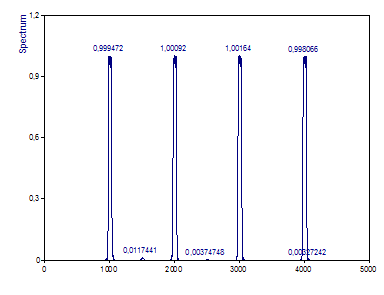
The spectral attenuation is not only a function of the Fourier width of the multitaper analysis, but it is also significantly impacted by how many tapers in the sequence are used. For the case where only the first three Slepian tapers are used, the attenuation in amplitude is about 48% as opposed to 56% when the maximum 5 tapers are used.
Selecting the type of normalization Amplitude compensates the attenuation perfectly.
Selecting the Best Method for High-Dynamic Range, Low Variance Fourier Analysis
(1) Be certain the data are wide-sense stationary (WSS) across the length of the signal. Use the STFT or CWT analyses to insure the spectral information is not varying across the sample. A data taper will significantly diminish the influence of the information at the two ends of the data stream. This should only be done if the influence of the data in the earliest and latest times in the sample can be safely de-emphasized.
(2) To reduce spectral leakage and achieve a high dynamic range Fourier analysis, a data tapering approach will generally be needed. As such, be prepared that spectral amplitudes and powers will be attenuated and cannot be read directly from the spectral peaks. To accurately gauge powers and amplitudes, use the amplitude type of normalization.
(3) If the data length is very large, the analysis begins with high resolution in the frequency domain. Some of this can be traded for the variance reduction offered by the periodogram.
(4) If the data length is limited and the aim of the analysis is to accurately estimate both frequencies and power, it may be necessary to use the single Fourier spectrum. The spectral peaks will have the maximum possible resolution, but there will be higher variance as random noise peaks will have a greater presence in the data. The Fourier Spectrum option is also the best way to test a given signal for differing from noise, since its windowed analyses offer white noise critical limits where these are available in the periodogram only for the unwindowed case.
(5) Similarly, if the data length is limited and the aim of the analysis is primarily to accurately characterize power, and especially if it essential to utilize all of the information in the data, including that near the bounds, the multitaper spectrum is likely to be the best choice.
(6) All three of the analyses have applicability to many spectral analysis problems. FlexPro simplifies method selection by placing all three of the algorithms in a single Fourier Analysis option. Use the Reference option for side-by-side comparisons of the various procedures. In certain instances, the best analysis may come from utilizing all three methods.
Step 3 - Output Options
In order to explore the objects FlexPro's analysis wizard can automatically create, we will generate a Fourier Spectrum.
For the Spectral Procedure select Fourier Spectrum. For the Spectrum Type select dB normalized. For the Window Type select Kaiser-Bessel and for the Window adjustment enter 3.0. Set the FFT length to 8192. Select the Maximum peak count option and enter 7. Now set the White Noise Critical Limit % to 99. Click on Toggle Labels until the frequency labels are displayed. Click on Next. In Step 3, check all three options and then click Finish.
Eight total objects are created in the FlexPro project database.
"Spectrum" is the analysis object. This is the object that performs the spectral analysis. Double clicking on this object will open the analysis object created by the wizard.
"Critical Limit" is the formula object for generating the critical limits used in the plot.
"Peaks" is the formula object for generating the peak information displayed in the plot.
"HarmonicAnalysis" is the formula object that generates the harmonic analysis report.
"Spectrum" is the Fourier Spectrum plot generated by the wizard. It uses the Spectrum, Critical Limit, and Peaks objects:
"Data" is a plot of the original time domain data.
"HarmonicAnalysis" is a table of the spectral information for the seven narrowband components specified by the Maximum peak count of 7. The table displays frequency, amplitude, phase, and Time-Integral Amplitude² power. The "% Power" sums the components to 100%, the "Relative %" assigns 100% to the component with greatest power.

"Fourier" is a document contains the spectral and data plots.
Spectral Analysis of Unevenly Spaced Data
We will now cover the Fourier spectral analysis capabilities of FlexPro when the data are unevenly spaced. The main focus will be on a Fourier procedure that is designed for data that have not been uniformly sampled.
You can skip the remainder of this tutorial if you will always be working with uniformly sampled data.
Open the Tutorials folder in the example project database and the Uneven Fourier subfolder and then double-click to open the 2D diagram called Data .
This is a graph of the signal. There are 1000 floating point values. The x values are increasing in the range from 0 to 10, but they are not evenly spaced. This is a worst-case scenario for the unevenly-spaced Fourier algorithm.
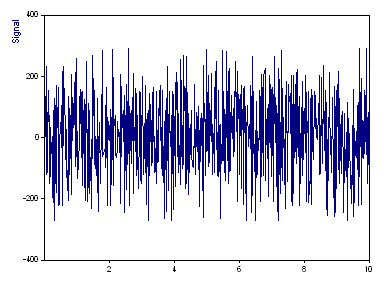
This data set contains three spectral peaks, one at a frequency of 30 (amplitude 100, phase 3π/2), another at a frequency of 70 (amplitude 100, phase π), and a third peak at the frequency of 120 (amplitude 100, phase π/2). The average Nyquist frequency is 50.05. There are thus two peaks beyond the average Nyquist limit.
One important difference between unevenly sampled data relative to uniformly sampled data is that information beyond the average Nyquist limit is not automatically aliased to lower frequencies. It is thus possible to extract information beyond this average Nyquist frequency since some of the data are spaced more closely and support a much higher "local" Nyquist frequency.
Similarly, there will be widely spaced points whose local Nyquist frequency is smaller than the overall average. The information within the average Nyquist range is thus incomplete.
Lomb-Scargle Periodogram
The Lomb-Scargle periodogram is an algorithm that specifically generates a Fourier spectrum for the instance where data are not uniformly spaced.
Close the diagram and highlight the data set Signal.
Click on Insert[Analyses] > Analysis Wizard. Select Unevenly Spaced Data Analyses within Spectral Analyses and then select Uneven Data Fourier. Click on Next.
In step 2 of the Analysis Wizard, we will begin by exploring the non-windowed Fourier spectrum with a maximum frequency equal to that of the average Nyquist.
For the Spectrum Type select dB normalized. For the Window Type select Rectangular -13dB W=1 (no windowing). Set the Number of Frequencies to 1024 and Nyquist Multiple to 1.0. Check Maximum peak count and enter 3. White Noise Critical Limit % is set to 99.
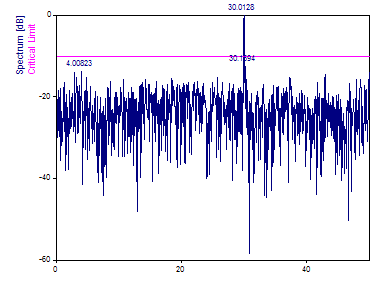
Only the frequency 30.0 peak is found as the peaks at frequencies 70.0 and 120.0 are beyond the average Nyquist value.
The largest peak is above the 99% critical limit, meaning that there is less than a 1 in 100 probability that this largest spectral feature arose from chance via random noise. Another way to state this is that of one-hundred white noise data sets having an equivalent variance, not even one would be expected to evidence a peak of this magnitude.
Note also this algorithm does not generate a frequency 0 value.
Extending the Spectrum Beyond the Average Nyquist Frequency
Change the Nyquist Multiple to 2.0. To keep the same density of spectral features, increase the Number of Frequencies to 2048.
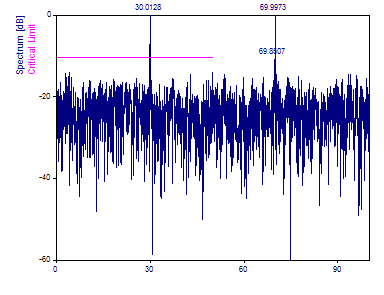
Note that the spectrum now recovers the 30 and 70 frequency components.
Change the Nyquist Multiple to 4.0. To keep the same density of spectral features, increase the Number of Frequencies to 4096.
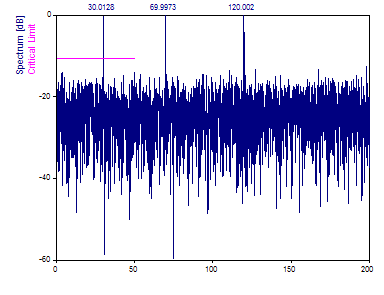
Extending the spectrum to 4x the average Nyquist limit, all spectral components are recovered, including the peak at frequency 120.
Note that this algorithm applies an internal interpolation that is not error-free. The sinusoids in the data are present without noise, and yet a noise floor of about -25 dB is observed. This limits the extent to which this procedure can be used for high-dynamic range Fourier analyses.
Data Tapering Window
FlexPro extends the algorithm to include windowing. All windows that can be created using unevenly sampled time values are included. The Chebyshev and Slepian (DPSS) windows are not available, although a special Chebyshev approximation window is available for creating the sharpest possible spectral peak for a given side lobe level.
Change the Window Type to Cos3 Minimum Sidelobe -71dB W=3.
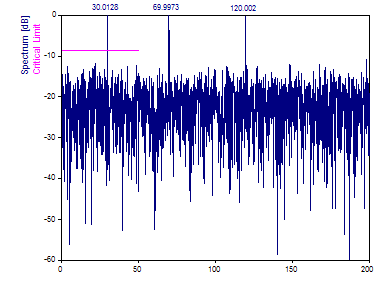
The intrinsic error in the algorithm is such that little benefit is realized from the data taper.
Critical Limits
The Lomb-Scargle periodogram normally includes a traditional confidence limit based upon an exponential distribution. This is not used in FlexPro. Instead, full critical limits are available. As with the evenly spaced Fourier procedures, separate critical limit models are used for each of the data windows and these are based on extensive Monte-Carlo trials. Since the distribution of abscissas can impact significance, these critical limits should be considered approximate.
Amplitude Attenuation
Change the Window Type to Rectangular -13dB W=1. Set the Normalization to Power and set the Nyquist Multiple field to 3. Select Amplitude as the Spectrum Type.
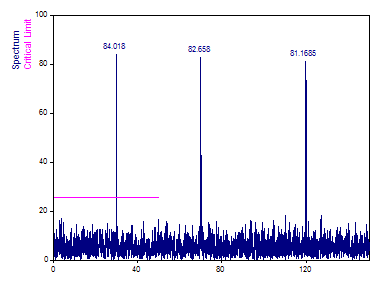
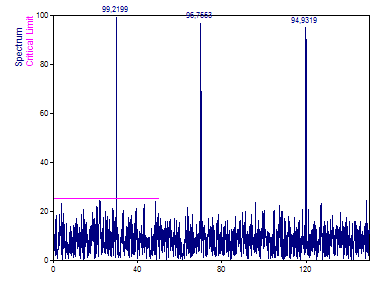
Unlike the evenly spaced Fourier analysis where no windowing resulted in the actual amplitudes being evident in the spectral plot, an attenuation occurs with the Lomb-Scargle algorithm if the signal energy has to be kept in the spectrum. The use of a data window further attenuates amplitudes and energies.
The choice of the normalization compensates the attenuation.
Click on Next. In Step 3, check all three options and then click Finish.
Eight total objects are again created in the FlexPro project database. The only difference is that the phase is not computed with the Harmonics object since it is not available in this algorithm.
References
A good introduction to digital signal processing is:
•Oppenheim, A. V. and Schafer, R. W. (1989). Discrete-Time Signal Processing. Prentice Hall, Englewood Cliffs, NJ.
•H.D. Lüke (1985). "Signalübertragung (Signal Transmission)". Springer-Verlag Berlin, Heidelberg, New York. ISBN 3-540-15526-0.
The FFT Algorithms used in FlexPro are described in:
•C. Temperton, "Implementation of a Self-Sorting In-Place Prime Factor FFT Algorithm", Journal of Computational Physics, v. 58, p. 283, 1985
•R. C. Singleton, "An Algorithm for Computing the Mixed Radix Fast Fourier Transform", IEEE Trans. Audio Electroacoust., v. AU-17, p. 93, June 1969
•L. R. Rabiner, R. W. Schafer, C. M. Rader, "The Chirp z-Transform Algorithm and Its Application", BSTJ, 48, p.1249, May-June 1969
Information on data tapering windows is given in:
•Albert H. Nuttall, "Some Windows with Very Good Sidelobe Behavior", IEEE Trans. ASSP, v29-1, Feb. 1981.
Information on multitaper spectra can be found in:
•Jonathan Lees and Jeffrey Park, "Multiple Taper Spectral Analysis", Computers and Geosciences, v21, p199, 1995.
See Also
You might be interested in these articles
You are currently viewing a placeholder content from Facebook. To access the actual content, click the button below. Please note that doing so will share data with third-party providers.
More InformationYou need to load content from reCAPTCHA to submit the form. Please note that doing so will share data with third-party providers.
More InformationYou are currently viewing a placeholder content from Instagram. To access the actual content, click the button below. Please note that doing so will share data with third-party providers.
More InformationYou are currently viewing a placeholder content from X. To access the actual content, click the button below. Please note that doing so will share data with third-party providers.
More Information