Test Series Analysis Tutorial
This tutorial shows you how to access the data and attributes of a test series for analysis purposes. You should already have some experience with FlexPro before you work through this tutorial.
Through this tutorial you will learn how to:
•access test series data and attributes using DataQuery,
•carry out analyses for a variable number of data sets,
•display calculation results and attributes in table form,
•exclude outliers from the analysis,
•sort your results by any attribute,
•and use data set parameters in an axis label.
If you have a license for the Data Explorer option, you will learn how to access data on your hard drive directly without having to import it first.
Note: The tutorial result is a project database called Series Analaysis.fpd, which is included with FlexPro. If you do not want to follow all the steps in the tutorial, you can leave it open and take a look at the objects. The objects are in the folder C:\Users\Public\Documents\Weisang\FlexPro\2021\Examples\Tutorials or C:>Users>Public>Public Documents>Weisang>FlexPro>2021>Examples>Tutorials.
Analyzing Imported Data
Setting up indexing
1.Launch FlexPro and choose the command File > Information > Project Database Properties.
2.Switch to the tab called Indexing.
3.Make sure that Activate data query indexing is selected.
Note: If the option is not already selected, this may be because the related setting in the Options dialog box on the Project Database tab under default settings for newly created project databases is not selected. To open the dialog box, choose File > Options.
Importing the test series data
4.Click the Data tab of the ribbon and set the options in the Import Settings group as shown in the picture:
5.Click Data[Import from Files and Databases] > Binary Data. The Import dialog box opens.
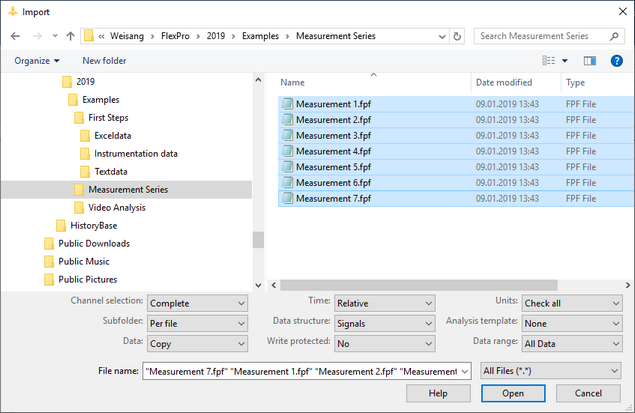
6.Switch to the folder C:\Users\Public\Documents\Weisang\FlexPro\2021 or C:>Users>Public>Public Documents>Weisang>FlexPro>2021. From there, switch to the subfolder Examples\Data\Measurement Series and select the seven files from Measurement 1.fpf to Measurement 7.fpf.
7.Click Open.
8.This opens the Verify Units dialog box, showing that the two units G and s are interpreted correctly. The files contain acceleration signals. Click Close.
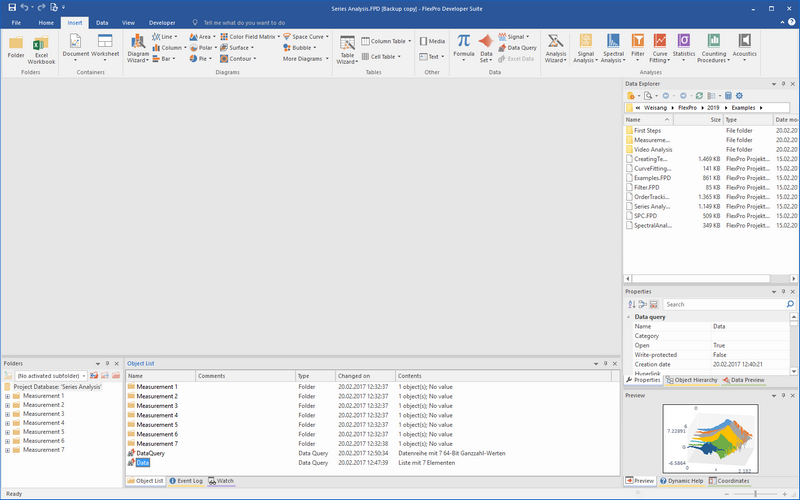
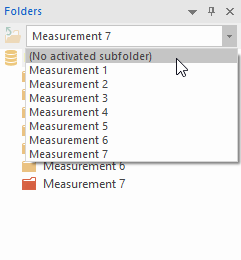
9.The folders Measurement 1 through Measurement 7appear in the Object List. Measurement 7 is highlighted red because it is activated. To change the focus from this folder, select (No activated subfolder) in the list box in the Folders window on the left next to the Object List.
Carrying Out a Data Query
To access the acceleration signals in the project database, use the DataQuery object.
1.Click Insert[Data] > Data Query.
2.The Data Query Properties dialog box opens, where you can change the query parameters.
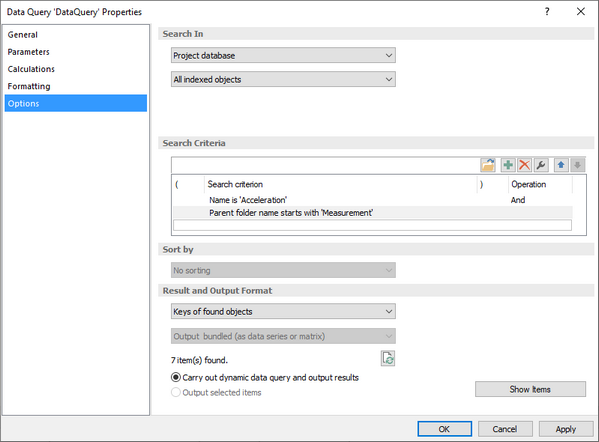
3.Under Search in do not change the Project Database and All indexed objects default settings. This states that the search will take place in the open project database and will search through the entire database.
4.You are looking for the acceleration signals. Therefore, the name is suitable as the first search criterion. In the Search criteria list, double-click on the existing criterion and set Name for the Search element with Search condition set to off .
5.Choose Acceleration from the list box on the right and close the dialog box by clicking OK.
6.To ensure that only the signals in the measurement folders are found, add one more search criterion. Click Add Search Criterion and select Parent folderas the search element. For the Search condition select begins with and for the Value enter Measurement. Next, close the dialog box by clicking OK.
7.Now you can test your data query by clicking on the Run data query button under Results. The message "7 item(s) found" should now appear on the left. If not, you will need to check your entries.
8.The options Values and Output as list are preselected under Result and Output Format. This is a list with the data of the acceleration signals. However, you will need not only the data itself, but also other attributes for the analysis. For this reason, the first data query provides only the keys of the found data sets, which will then be used in additional queries to access the data and attributes. You should therefore select Keys of found objects.
Note: Why are we discussing objects and not data sets? You can use the data query to access data in the project database and external data on your hard drive (the latter requires the Data Explorer option). You can access channels on your hard drive that contain files, and you can access data objects (data sets, analyses, formulas) in folders in the project database.
9.Now close the dialog box by clicking OK.
10.Review your data query. The text in the Contents column of the Object List should be "Data series with 7 64-bit integer values ".
Accessing the data in the found data sets
1.Select the data query that you just added to the Object List, then click again on Insert[Data] > Data Query. FlexPro will now add another data query and will link it to the existing one. In the Data Query Properties dialog box, you can see that under Search in the option Objects with keys is selected in the second list box, and you will see the previously created data query underneath it. The option Get result only, no further search is already selected. This states that no additional search criterion will be used; only a result for the existing data query will be accessed.
2.The results of the data query should be output sorted by measurement name. The measurement name is the name of the folder that contains the found data set. Therefore under Sort, selectParent folder names.
3.Values as list is already selected as the result. However, the list items of the result should not be given the name of the data set, which is always "Acceleration", but should be the name of the measurement folder. Therefore, select Parent folder from the Name usingfield.
4.Next, click OK.
5.Rename the newly created DataQuery2 by pressing F2 and then entering "Data". The data will be displayed in the preview as a 3D diagram.
Analyzing the Data
Acceleration signals have a variable frequency and amplitude. In the following, the maximum occurring spectral amplitude for each signal and the frequency at which it occurs will be determined.
The Data object provides the seven acceleration signals as a list with seven items. FlexPro should now run the steps of the analysis as multichannel so that for each step a new list with seven results is generated.
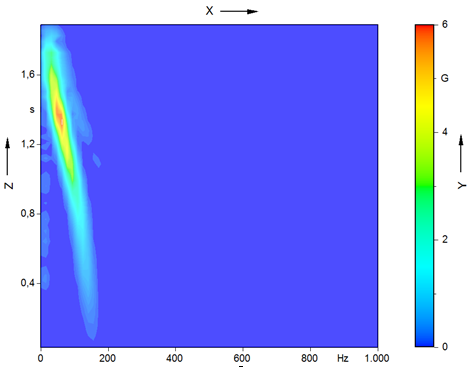
The first step in the analysis is to calculate the time-frequency spectrum for the data. In this case, a two-dimensional data set is generated for each signal, with the frequency in the X component, time in the Z component and amplitude in the Y component, as shown here:
1.Select the Data object in the Object List and choose Insert[Analyses] > Spectral Analysis > Time-Frequency Spectrum.
2.In the Select List Items dialog box that appears (because the Data object produces a list with multiple data sets), do not change the Complete list default setting; just click OK.
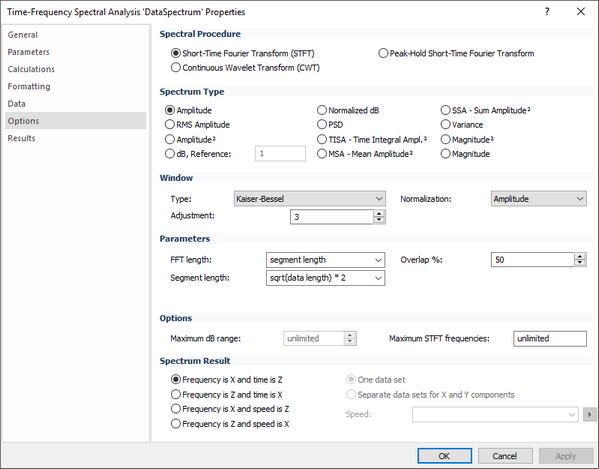
3.In the Time-Frequency Spectral Analysis Properties dialog box, select Amplitude under Spectrum Type and under Window, select the Kaiser-Bessel with Adjustment 3 type. You can leave all other settings unchanged.
4.Close the dialog box by clicking OK. FlexPro will now add a new object called DataSpectrum, which will generate a list with seven spectra.
Now for the second analysis step: determining the amplitude maxima.
1.Select DataSpectrum from the Object List and choose Insert[Analyses] > Statistics > Maximum.
2.Close the Select List Elements dialog box again by clicking OK.
3.In the Statistical Quantity Properties dialog box, Quantities for rows is already selected. Do not change the default settings. Just close by clicking OK.
The key is to understand the Quantities for rows setting. This means that for each row in the original data set - which is two-dimensional - a maximum is to be generated. You will understand what this means if you look at a time-frequency spectrum in the data view:
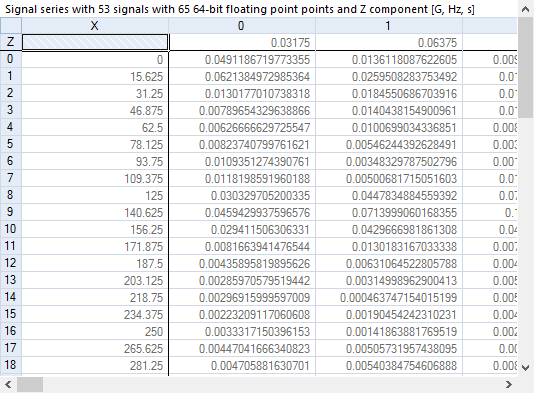
The Z component with the times is in the top row. The frequencies are in the left-hand column and the amplitudes are in the matrix. Now if a maximum is to be generated for each row, then the result is a signal with the maximum spectral amplitude across the frequency, i.e. a maximum is generated for each row of the matrix.
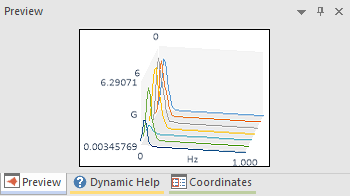
The DataSpectrumMaximum object generates a list with seven of these types of signals:
To obtain the first result of the analysis (the maximum spectral amplitude in the acceleration signal), you only have to generate the maximum one more time.
4.Select DataSpectrumMaximum from the Object List and choose Insert[Analyses] > Statistics > Maximumagain.
5.Close the Select List Items dialog box again by clicking OK.
6.In the Statistical Quantity Properties dialog box do not change the default settings. Just close by clicking OK.
7.Press F2 and rename the newly created object to SpectralAmplitude. The object generates a list with seven scalar values.
In the third step in the analysis, you will determine the frequencies at which the maxima occur. The Event Isolation analysis object is ideal for this purpose. You can use it to search for the maxima in the signals that generate the DataSpectrumMaximum and output the frequency at which they occur:
8.Select DataSpectrumMaximum from the Object List again and choose Insert[Analyses] > Filters > Event Isolation.
9.Close the Select List Items dialog box again by clicking OK.
10. In the Event Isolation Properties dialog box, double-click on the preset event.
11.In the Event dialog box, select the event called Global Extrema.
12.Leave Positive as the Orientation. This will ensure that only the global maximum will be found. Close the dialog box by clicking OK.
13.In the Event Isolation Properties dialog box, select X value of next event as the result. The signals that provide the DataSpectrumMaximum have the frequency you are looking for in their X component.
14.Close the dialog box by clicking OK.
15.Press F2 and rename the newly created object to Frequency. The object generates a list with seven scalar values.
Displaying events as tables
1.Select the two results SpectralAmplitude and Frequency object in the Object List and click on Insert[Tables] > Table Wizard.
2.SpectralAmplitude generates a list, which is why the Select List Items dialog box appears. Select the option Convert the list into a data series. This will ensure that the seven scalar values are displayed one after another in a single column and not side by side in seven columns.
3.Close the dialog box by clicking OK.
4.Frequency also generates a list, which is why the Select List Items dialog box reappears. As before, select the option Convert the list into a data series and then close the dialog box by clicking OK.
5.Leave the default selection in the wizard and click Finish.
The new table should now look like this:
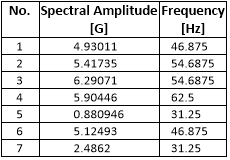
To improve the legibility of the table, the measurement name and the serial numbers of the measured unit under test need to be added as columns. You can access these attributes using additional data queries:
1.Select the DataQuery object from the Object List and choose Insert[Data] > Data Query.
2.In the Data Query Properties dialog box, under Result, select Parent folder names and in the field under that select Output concatenated (to data series or signal). Since the acceleration signals are in the folders labeled with the measurement names, this will provide the information you are looking for.
3.The results of this data query should also be output sorted by measurement name. Therefore, under Sort choose Parent folder name.
4.Next, click OK.
5.Press F2 and rename the newly created object to MeasurementName. The object generates a data series with seven strings.
6.Drag the mouse to move the MeasurementName object from the Object List to the second column of the table and drop it there.
7.Widen the table border so that all columns are displayed completely.
The new table should now look like this:
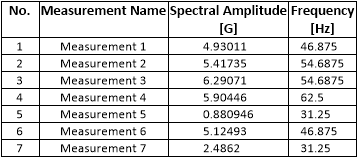
Now only the serial numbers are missing. These are in the acceleration signals as the text parameter "SN".
8.Select the DataQuery object from the Object List and choose Insert[Data] > Data Query.
9.In the Data Query Properties dialog box, under result, select Parameter text and in the field under that select Output concatenated (to data series or signal). Under Parameters next to it, select SN.
10.The results of this data query should also be output sorted by measurement name. Therefore, under Sort, select Parent folder names.
11. Close the dialog box by clicking OK.
12.Press F2 and rename the newly created object to SerialNumber. The object generates a data series with seven strings.
13.Add this result to the table using drag-and-drop as well.
The finished table should now look like this:
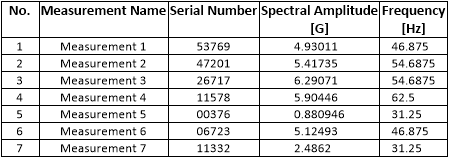
Note: If the column arrangement is not correct yet, you can rearrange them in the table using drag-and-drop.
Excluding Outliers from the Analysis
The amplitude for Measurement 5 is significantly below that of the rest of the measurements. Refining the data query lets you exclude this data set from the analysis.
1.Double-click on the DataQuery object in the Object List.
2.Click on Add Search Criterion and select for the Search element Maximum. As the Search condition select Greater than or eq. to and for the Value enter 2. Next, close the dialog box by clicking OK.
3.Test your data query by clicking the Run data query button under Results. The message "6 item(s) found" should now appear on the left.
4.To close the Properties dialog box, click OK.
5.If the table does not update automatically, click in the table and then press F12 so that it will refresh.
Measurement 5 now no longer appears in the table.
Displaying the acceleration signals as a diagram
1.Select the Data object in the Object List and click on Insert[Diagram] -> Diagram Wizard.
2.Close the Select List Items dialog box by clicking OK.
3.In the Diagram Wizard select the subtype Lines stacked.
4.The number of data sets may vary per data query and the number of curves in the diagram should then be adjusted automatically. Therefore, select the option Dynamic Axes and Curves.
Note: The diagram is created with only one curve and only one axis for the entire list. The number of scales of the axis and series in the curve is then automatically adjusted to the number of list items.
5.The diagram is created and opened. Use the command Cursor Tools[Cursors] > On/Off to disable the cursors, if necessary.
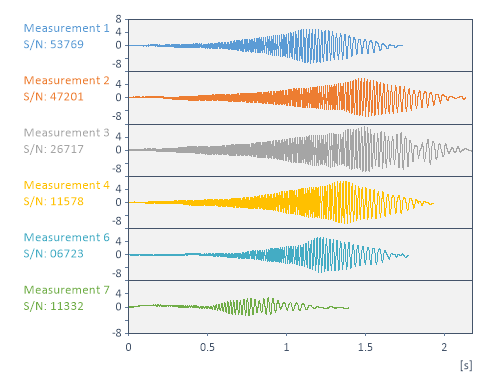
The list element name is used as the axis label by default. Do the following to use the serial number for the name as well:
1.Double-click on the axis label (not on the scaling) of the top curve to open the Properties dialog box.
2.Under Y Axis Labeling first select the Name entry from the Fields list.
3.Now switch to the second line and select Parameters from the Fields drop-down menu.
4.In the field listed, replace the <Name> placeholder with SN and type S/N: before the inserted placeholder. The text should now look like this:
%<Name>
S/N %{.Data.YValueObject(%<ListElement>).Parameters("SN")}
5.Close the dialog box by clicking OK in order to see the following:
Analyzing Data on the Hard Drive
If you have a license for the Data Explorer option, you can run queries directly on data on your hard drive.
Setting up Indexing
1.If Data Explorer does not appear, press CTRL+ALT+X or select View[Task Windows] > Show > Data Explorer to open the window.
2.Click Options in the Data Explorer toolbar to view the Indexing tab of the Optiondialog box.
3.For the Mode select Always index.
4.Under File Types to Index select the option Index all supported file types.
5.Under Locations To Index make sure that C:\Users\Public is entered and highlighted. Under Subfolders make sure Yes is selected. FlexPro example files are in this folder.
6.Now click on the Indexing Details button at the top right to view the file indexing status.
7.Wait, if necessary, until the files Measurement 1.fpf through Measurement 7.fpf have been indexed and then close both dialog boxes by clicking OK to close both dialog boxes.
Note: If the files are not displayed and you are not sure if they were indexed correctly, then in the Options dialog box, click on the Reset index button and then reopen the Status window.
Displaying the Acceleration Signals in Data Explorer
1.Click on the Search button in Data Explorer to open the Select / Edit Search Filter dialog box.
2.Under Search filter in select Personal template database. This allows you to use the search filter later for other projects as well.
3.Now click Add New Search Filter and name the filter AccelerationSignals.
4.In the Search criteria list, double-click on the existing criterion and set Name for the Search element with Search condition set to off.
5.Choose Acceleration from the list box on the right and close the dialog box by clicking OK.
6.Click Add Search Criterion and select Parent folder for the search element.
7.As the Search condition select begins with and for the Value enter Measurement. Next, close the dialog box by clicking OK.
8.In the Data Explorer toolbar, click on Change View and select List view (indexed data sets).
9.Now the seven acceleration signals will be visible in Data Explorer.
Useful Information about Data Explorer
•Use the Change View button in the toolbar of the Data Explorer window to toggle between the list and tree views of data sets or files.
•If you select a data set, it will appear in the Preview and its header information will appear in the Properties window.
•To import one or more data sets, select them in Data Explorer and drag them with your mouse to the Object List. If you press and hold CTRL and SHIFT at the same time, links will be added to the project database.
•Alternatively, you can also copy or link them via the Data Explorer context menu. To do this, right-click with your mouse on the highlighted item(s).
•If you click on the arrow next to the Data Explorer Search button, a menu will appear in which you can select a search filter.
•In the project database or template database you can save as many search filters as you need. In Data Explorer itself you can add a standard search filter that you can select from the menu using Find....
•Search filters that you add to the project database or template database can also be used in data queries.
Setting up the data query for external data
The previously added DataQuery object will access the imported measurements 1 through 7 and so it should now be changed to access the data on the hard drive directly.
1.Double-click on the DataQuery object to open its Properties window.
2.Under Search in select Indexed files - Local File Indexing.
3.Now click the button under Search criteria called Load Search Criteria.
4.In the Select / Edit Search Filter dialog box, select Search filter in from the Personal template database.
5.The search filter AccelerationSignals should already be selected. If not, select it from the Name list.
6.Next, click OK to close the dialog box so that you can copy the search filter search criteria to the DataQuery object.
7.Click Run data query to verify that seven items are found.
8.The criterion for excluding outliers is still missing. You will therefore need to add the Greater than or eq. to 2 criterion to the list.
9.The linked data queries have not yet been switched to the external data source. Select the objects Data, MeasurementName and SerialNumber from the Object List, scroll down the FlexPro Properties window until you see Search in and select In indexed files.
Note: Using the object key, which the DataQuery object provides, FlexPro cannot detect whether the key relates to data in the project database or external data. You will therefore always have to make sure that the same source is set in the linked queries as in the query that provides the key.
Now if you update the previously created diagram and table, they should provide the exact same results as that of the query for imported data. The measurement folders Measurement 1 through Measurement 7 are now no longer required, so you can delete them from the project database.
See Also
You might be interested in these articles
You are currently viewing a placeholder content from Facebook. To access the actual content, click the button below. Please note that doing so will share data with third-party providers.
More InformationYou need to load content from reCAPTCHA to submit the form. Please note that doing so will share data with third-party providers.
More InformationYou are currently viewing a placeholder content from Instagram. To access the actual content, click the button below. Please note that doing so will share data with third-party providers.
More InformationYou are currently viewing a placeholder content from X. To access the actual content, click the button below. Please note that doing so will share data with third-party providers.
More Information

