Statistical Quantity Analysis Object
You can use this analysis object to calculate different statistical characteristic quantities for a data set.
Calculating a statistical characteristic quantity leads from a sample (data series) to a scalar value, which describes a certain property of the sample. Based on a specified interval width, extreme values, mean values and quantiles can also be calculated in blocks or floating. With block calculation, the result contains one value per interval. For a floating calculation, the number of values remains the same. For each value, the range around this value specified by the interval width is considered.
All characteristic quantities can be determined for all data structures except scalar values. For data series, the result is a scalar value, unless a floating or block calculation was selected. For data matrices, you can calculate statistical characteristic quantities either for their columns or rows, or globally for the entire data set. If you select the Quantities for columns option, a characteristic quantity is calculated for each individual column (data series) in the data matrix. As a result, you will then obtain a data series whose number of values corresponds to the number of columns (data series) in the data matrix. If you select the Quantities for rows option, a characteristic quantity is calculated for each row. As a result, you then obtain a data series whose number of values corresponds to the number of rows in the data matrix. The Average columns beforehand converts the matrix into a data series by arithmetic averaging before calculating the parameter, and the option Concatenate columns beforehand appends the columns to a long data series. The result then corresponds to that which would be obtained for a corresponding data series. Use the Concatenate columns beforehand option, for example, to determine the global maximum of a signal series.
For aggregated data structures, signals, signal series and space curves, only the Y component is considered. When calculating a floating characteristic quantity, the X and Z components are copied unchanged into the result. If a block characteristic quantity is calculated, then the data of the X or Z components, dependent on the calculation direction, are decimated, whereby the current first value of a block is adopted into the result.
Sums *
Characteristic Quantity |
Formula |
Note |
|---|---|---|
Sum |
|
Sum of the Data |
Square Sum |
|
Sum of Squares of the Data |
Extreme Values
Characteristic Quantity |
Formula |
Note |
|---|---|---|
Minimum |
|
Lowest Value |
Maximum |
|
Highest Value |
Mean Values
Characteristic Quantity |
Formula |
Note |
|---|---|---|
Arithmetic Mean |
|
Average Value |
Root Mean Square (Effective Value) |
|
Specifies the amplitude of a constant signal of the same power. |
Geometric Mean * |
|
To be used when the measured values are relative quantities (multiplicative). Corresponds to the arithmetic mean with a logarithmic scale. |
Harmonic Mean * |
|
|
Moments *
Characteristic Quantity |
Formula |
Note |
|---|---|---|
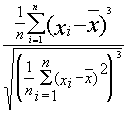
Skew |
|
Measure for the symmetry of a distribution. Values lower or greater than zero specify that the distribution is inclined to the left or right. The skew is zero for a symmetrical distribution. |
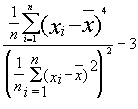
Excess |
|
The excess specifies the difference between the kurtosis of the function under consideration and the kurtosis of the density function of a normally distributed random quantity. Values greater or less than zero specify that the absolute maximum of the distribution is greater or less than that of the assigned normal distribution (with the same variance). |
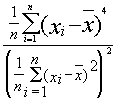
Kurtosis |
|
The kurtosis is a measurement for steepness or “peakedness factor” of a distribution. |
Quantile *
To calculate the quantile, the data is sorted in ascending order, and then the value at position n / α is taken. If n / α is not a whole number, interpolation takes place between the two neighboring values.
Characteristic Quantity |
Formula |
Note |
|---|---|---|
Lower Quartile |
|
|
Median |
|
|
Upper Quartile |
|
|
Dispersion Measures *
Characteristic Quantity |
Formula |
Note |
|---|---|---|
Range |
|
Range between the highest and lowest value. |
Standard Deviation |
|
Square root of the variance. |
Variance |
|
Square dispersion measure, related to the arithmetic mean. |
Mean Square Error |
|
As with the variance, but related to the complete number of values. |
Interquartile Range |
|
Difference between the upper and lower quartile. |
Absolute Coefficient of Variation |
|
Standard deviation, related to the mean value. |
Relative Coefficient of Variation |
|
Coefficient of variation, related to its absolute maximum. |
Mean Absolute Deviation from the Median |
|
|
Mean Absolute Deviation from the Mean |
|
|
Crest factor |
|
Peak value, related to the effective value. |
Quartile coefficient of dispersion |
|
|
FPScript Functions Used
* This category or quantity is not available in FlexPro View.
You might be interested in these articles
You are currently viewing a placeholder content from Facebook. To access the actual content, click the button below. Please note that doing so will share data with third-party providers.
More InformationYou need to load content from reCAPTCHA to submit the form. Please note that doing so will share data with third-party providers.
More InformationYou are currently viewing a placeholder content from Instagram. To access the actual content, click the button below. Please note that doing so will share data with third-party providers.
More InformationYou are currently viewing a placeholder content from X. To access the actual content, click the button below. Please note that doing so will share data with third-party providers.
More Information


