Histogram Analysis Object *
You can use this analysis object to create histograms for your data.
To create a histogram, you first separates the range of values in your data set into a certain number of classes. FlexPro then counts the numbers of values for each class, and these numbers then form the histogram.
There are two ways of specifying the classes: You can specify the number of classes, into which FlexPro should separate the range of values. FlexPro then first determines the maximum and the minimum of the data set and separates the range in between into the specified number of equally-sized classes.
You can also specify a data set that contains class limits. To obtain N classes, the data set must then contain N-1 strictly increasing values, which each separate two neighboring classes. All of the values in the source data set that are less than the first value in the data set with the class limits are assigned to the first class. All values that lie above the last limit apply to the last class. In this case, the intervals for the first and last class are open. You can also define classes with different widths by specifying a data set for the class division.
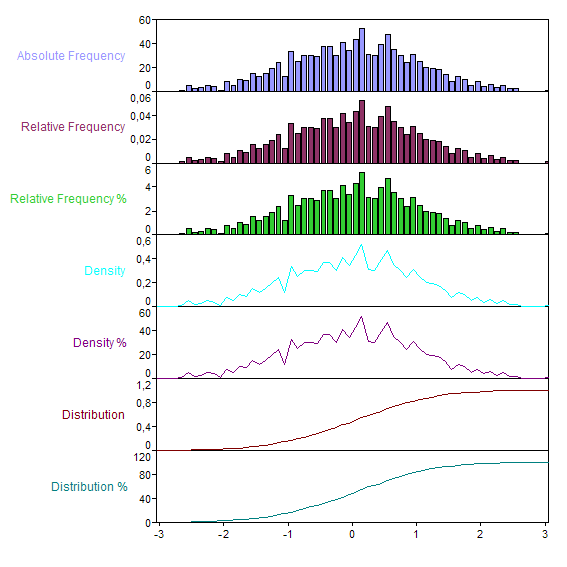
The analysis object can output the result of the count in seven different normalizations:
Result |
Description |
|---|---|
Absolute Frequency |
Provides the absolute frequencies in individual classes. |
Relative Frequency |
Provides the frequencies, normalized to the sum of one, in the individual classes. |
Relative Frequency, percentage |
Provides the frequencies, normalized to the sum of one hundred, in the individual classes. |
Density |
Provides the empirical probability density, i.e., the frequencies, normalized to an integral of one, in the individual classes. |
Density, percentage |
Provides the empirical probability density in percent, i.e., the frequencies, normalized to an integral of one hundred, in the individual classes. |
Distribution |
Provides the empirical probability density, i.e., the cumulative frequencies normalized to a maximum value of one. |
Distribution, percentage |
Provides the empirical probability density in percent, i.e., the cumulative frequencies normalized to a maximum value of one hundred. |
The analysis object provides a signal or signal series as a result whose Y component contains the frequencies counted and whose X component contains the mid-points of the selected classes. For example, if you create a column chart, the columns appear in the center of the classes assigned to them. Since, however, the object works with open marginal classes and thus their widths are indefinite, the same width is assumed for the marginal classes to calculate their class centers as for their direct neighbor classes.
The following illustration shows the different results for a normally distributed random signal with 1000 values. The variance of the normal distribution is equal to one. To divide classes, a data set with 61 equidistant class limits in the interval [-3, +3] uses:
FPScript Functions Used
See Also
* This analysis object is not available in FlexPro View.
You might be interested in these articles
You are currently viewing a placeholder content from Facebook. To access the actual content, click the button below. Please note that doing so will share data with third-party providers.
More InformationYou need to load content from reCAPTCHA to submit the form. Please note that doing so will share data with third-party providers.
More InformationYou are currently viewing a placeholder content from Instagram. To access the actual content, click the button below. Please note that doing so will share data with third-party providers.
More InformationYou are currently viewing a placeholder content from X. To access the actual content, click the button below. Please note that doing so will share data with third-party providers.
More Information