Visually Analyzing Data
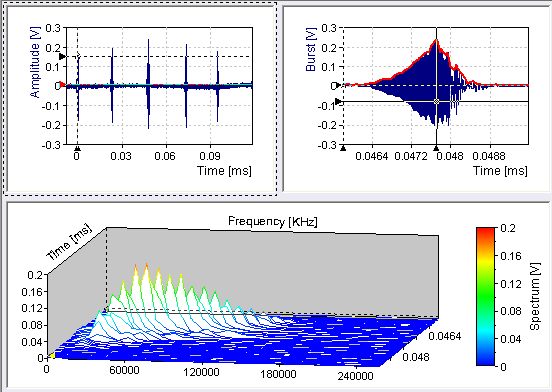
If you would like to interactively analyze data in a spreadsheet, you often have no choice but to look at the columns of values or the diagrams created. With FlexPro you can measure the curves in your diagram using cursors. Cursors work in 2D and 3D diagrams. You can zoom into sections, edit data, cut out areas and much more. The values under the cursors are displayed in a coordinates window. As an advanced FlexPro user, you can tailor the contents of the coordinates window to fit your needs.
FlexPro also allows you to synchronize cursors across several diagrams. To do this, use the worksheet. This is a window that can be split into up to 16 panes. You can insert diagrams into these panes and measure the curves of the diagrams with the cursors.

By the way: In addition, anything you can do in a worksheet can also be done in a document. However, the worksheet is often more practical for working onscreen.
Next Topic
You might be interested in these articles
You are currently viewing a placeholder content from Facebook. To access the actual content, click the button below. Please note that doing so will share data with third-party providers.
More InformationYou need to load content from reCAPTCHA to submit the form. Please note that doing so will share data with third-party providers.
More InformationYou are currently viewing a placeholder content from Instagram. To access the actual content, click the button below. Please note that doing so will share data with third-party providers.
More InformationYou are currently viewing a placeholder content from X. To access the actual content, click the button below. Please note that doing so will share data with third-party providers.
More Information